
Summary:
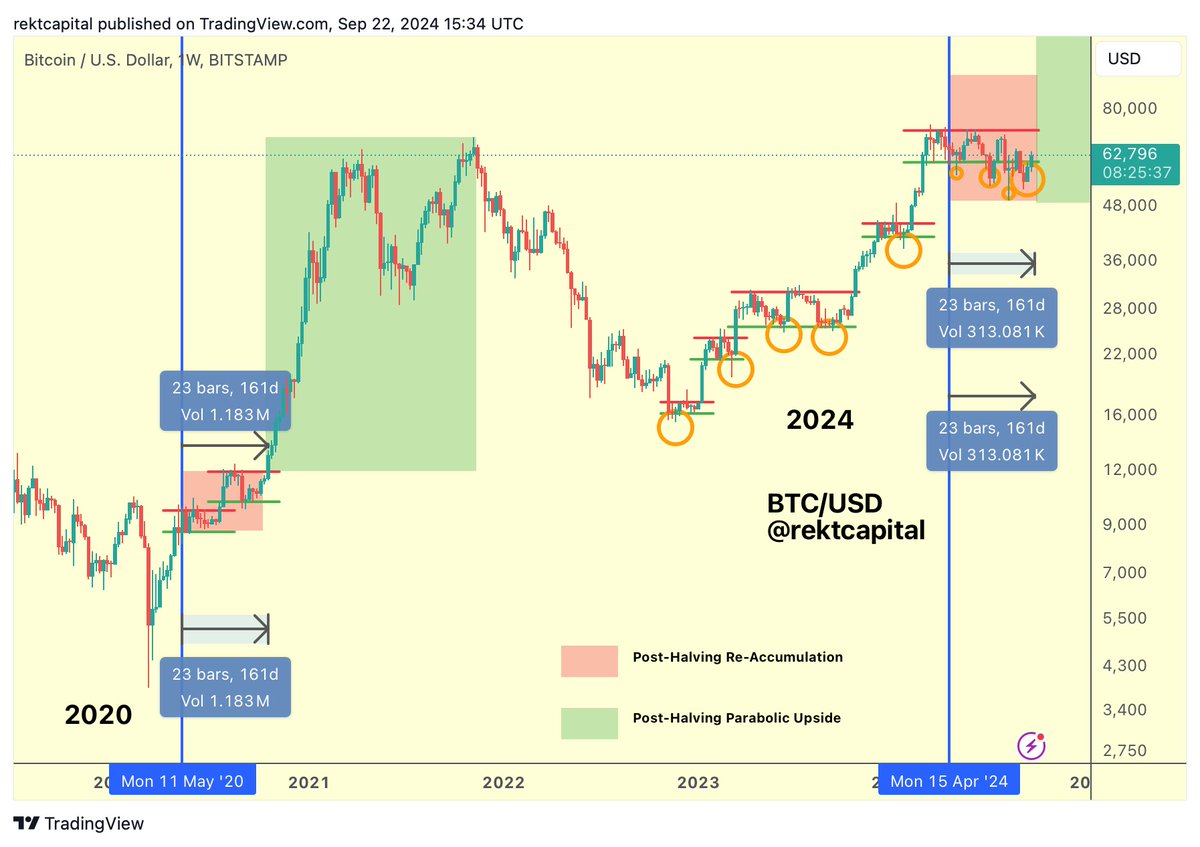
Bitcoin reached a critical milestone 161 days post-halving, similar to 2020.
Rekt Capital notes historical parallels in Bitcoin's upward moves post-halving.
Both 2020 and 2024 saw Bitcoin enter a reaccumulation phase lasting around 161 days.
Differences in market conditions may affect the outcomes of potential breakouts.
Trading volume has significantly decreased, with Bitstamp seeing a 73% decline.
Bitcoin's Critical Milestone
Bitcoin has reached a critical milestone 161 days after its April halving, mirroring a pivotal moment from 2020 when the digital asset broke out from its reaccumulation range. Rekt Capital highlighted this temporal alignment, noting that in 2020, Bitcoin began a significant upward move exactly 161 days post-halving.
Historical Parallels
Rekt Capital’s chart compares the post-halving periods of 2020 and 2024, revealing striking similarities. Both times, Bitcoin entered a reaccumulation phase lasting approximately 161 days after the halving events, culminating in a parabolic rally as Bitcoin broke through resistance levels it had repeatedly tested.
Support and Resistance Levels
Support and resistance levels in both periods show consistent testing and retesting, forming a foundation for possible upward momentum. Rounded bottom patterns observed in the charts signal accumulation and may further support the breakout thesis.
Market Conditions Matter
While historical patterns indicate the potential for a significant move, differences in market conditions, such as volume, highlight that outcomes may not be identical. A notable difference is the trading volume on the chart, which uses Bitstamp. In 2020, Bitstamp’s volume during the 161-day post-halving period was 1.183 million, whereas in 2024, it stands at 313,081. This divergence suggests a change in market participation, which could impact the nature of any potential breakout.
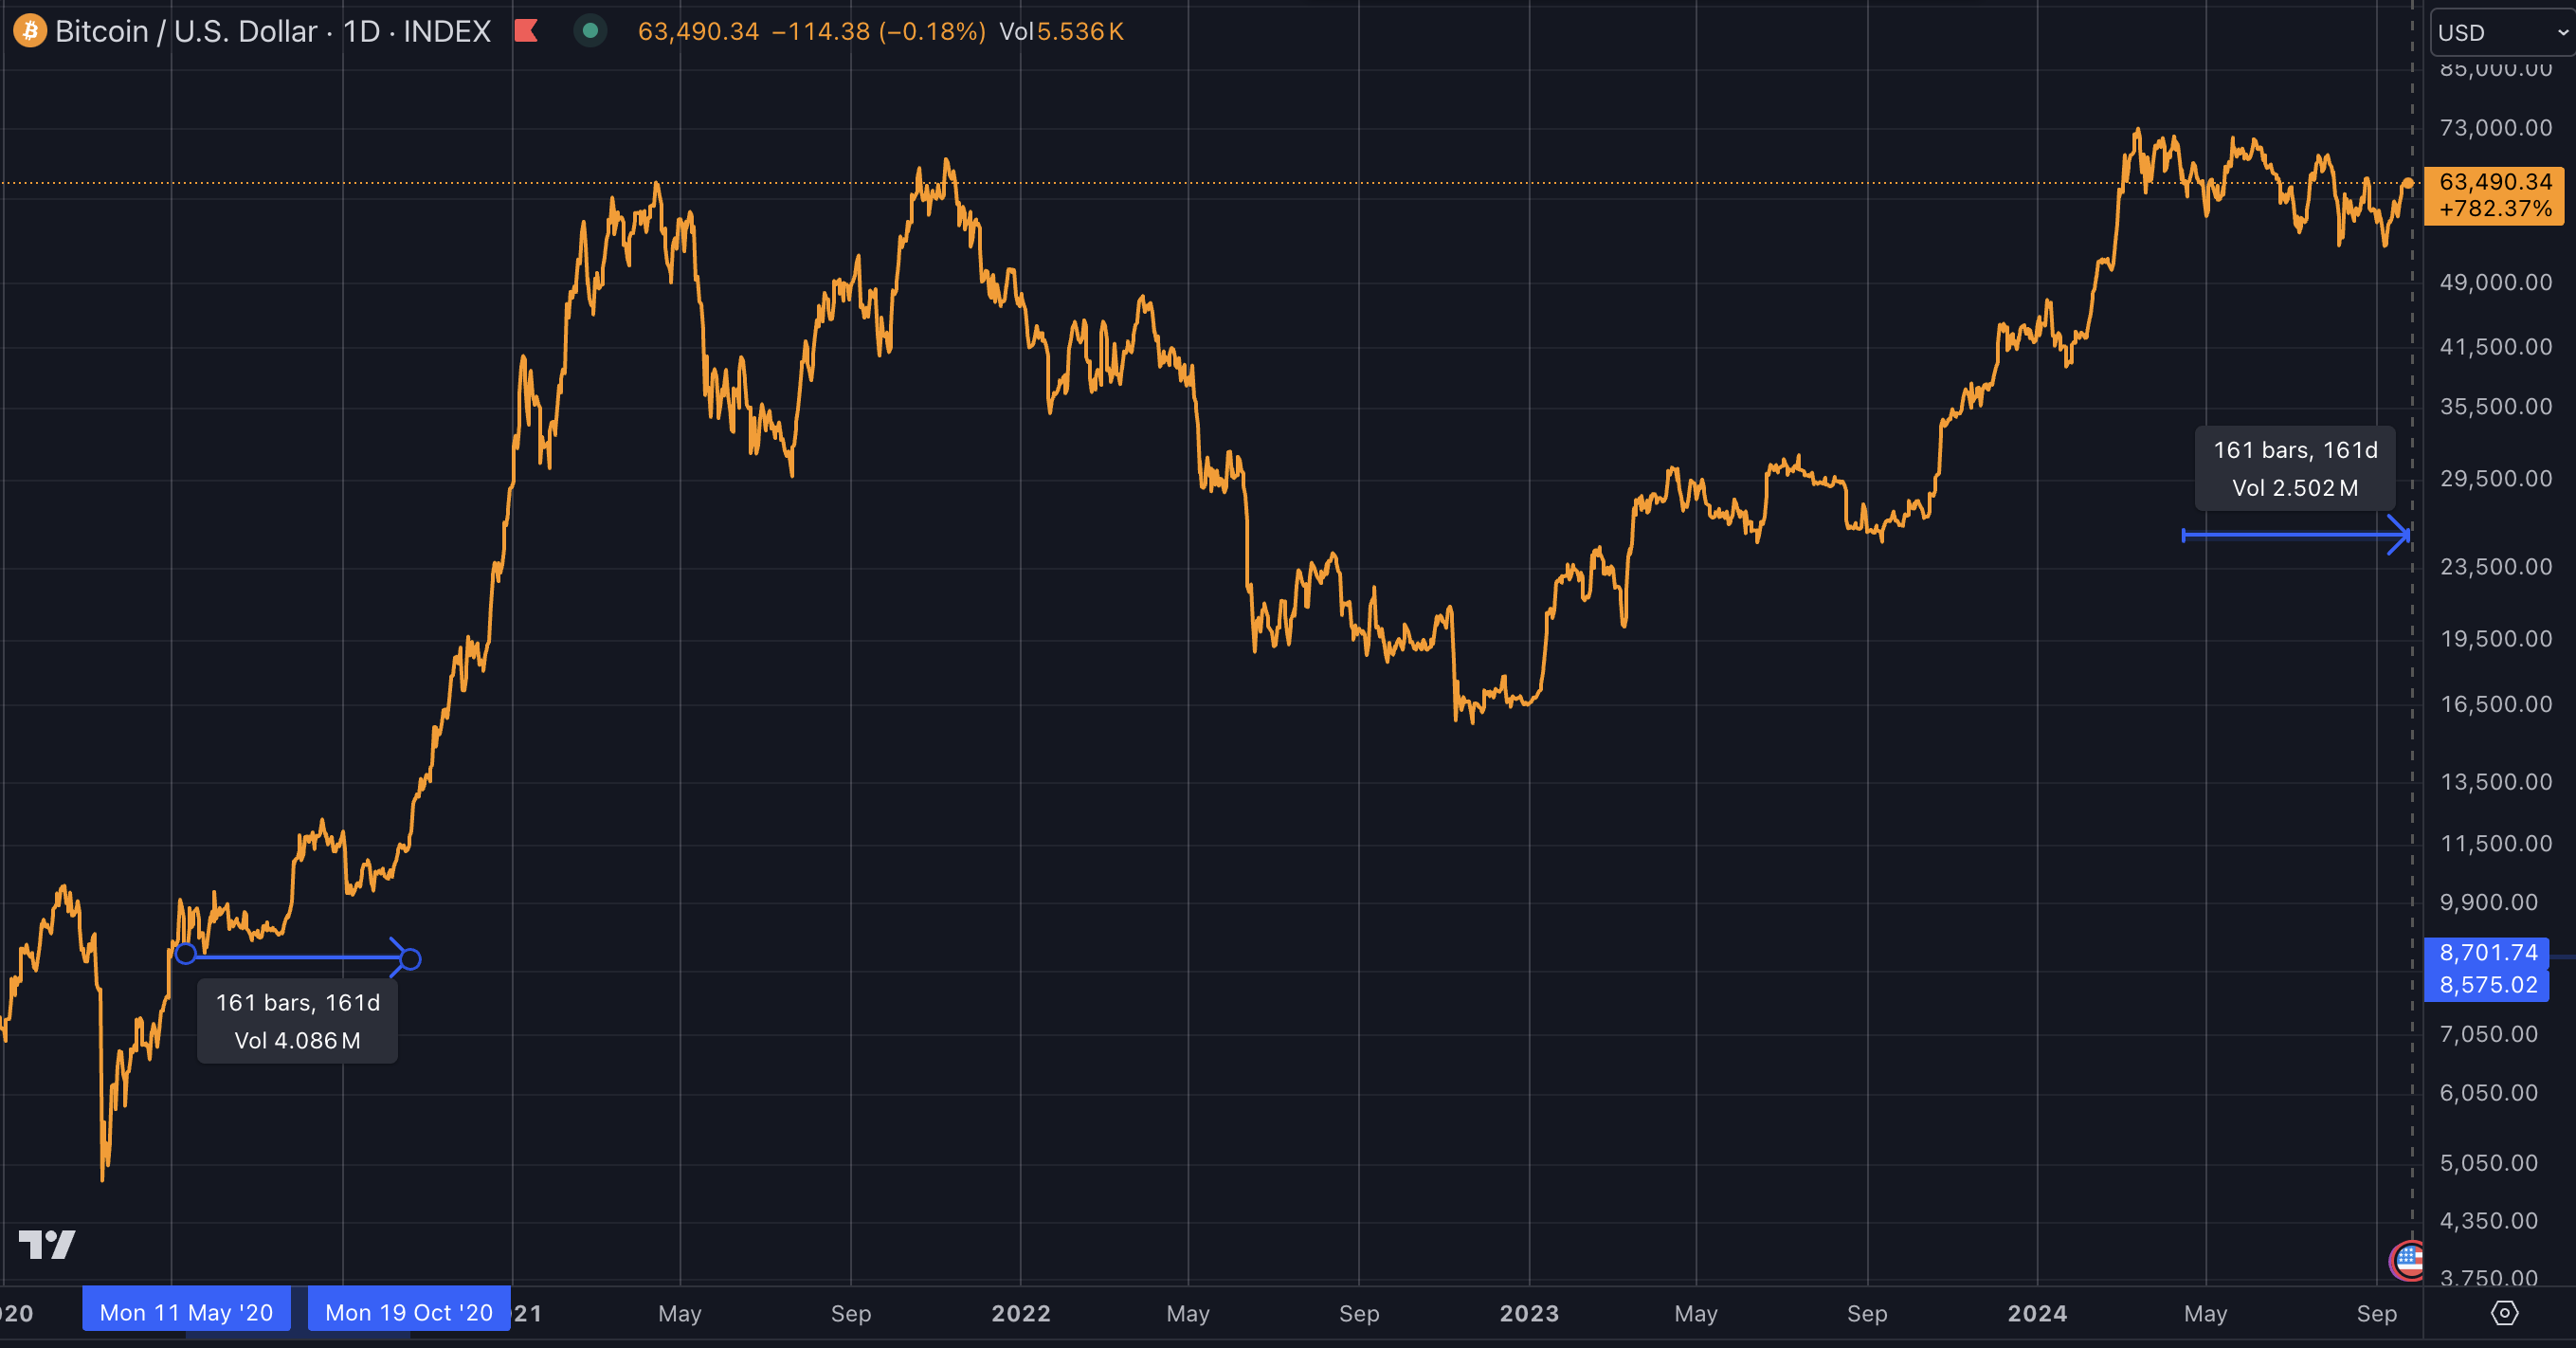
Across all exchanges, CryptoSlate’s chart shows 2.5 million in trading volume since this year’s halving, compared to 4 million in the 161 days after the 2020 halving. This confirms the reduction in volume since the comparative period last cycle, with Bitstamp seeing a 73% decline and TradingView’s combined index depicting a 37% decrease.


Comments