Summary:
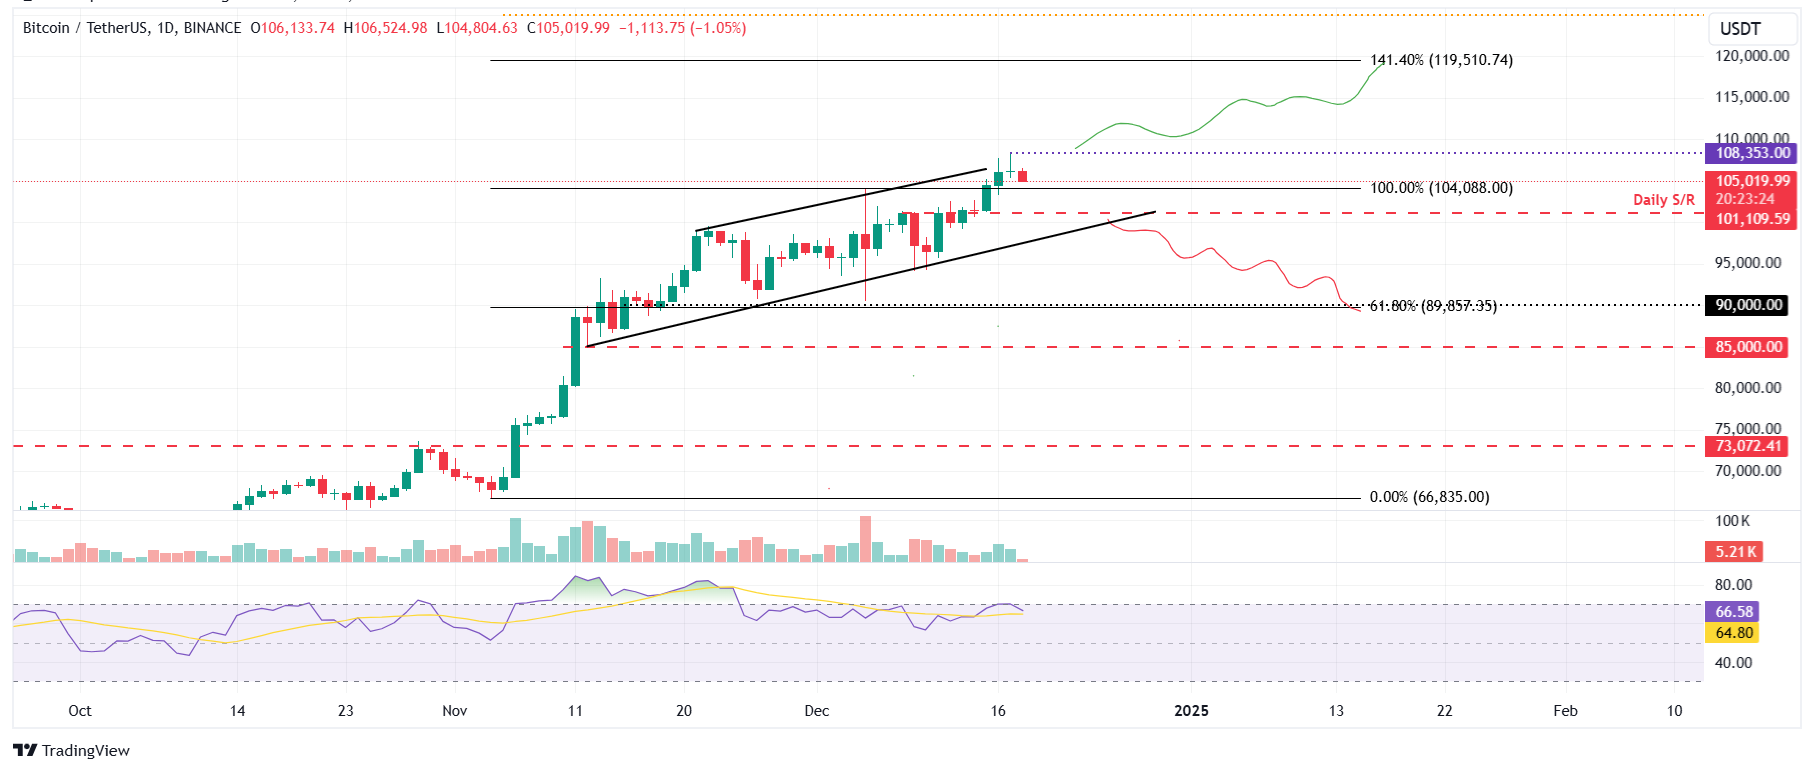
Bitcoin price slightly down after hitting a new all-time high of $108,353.
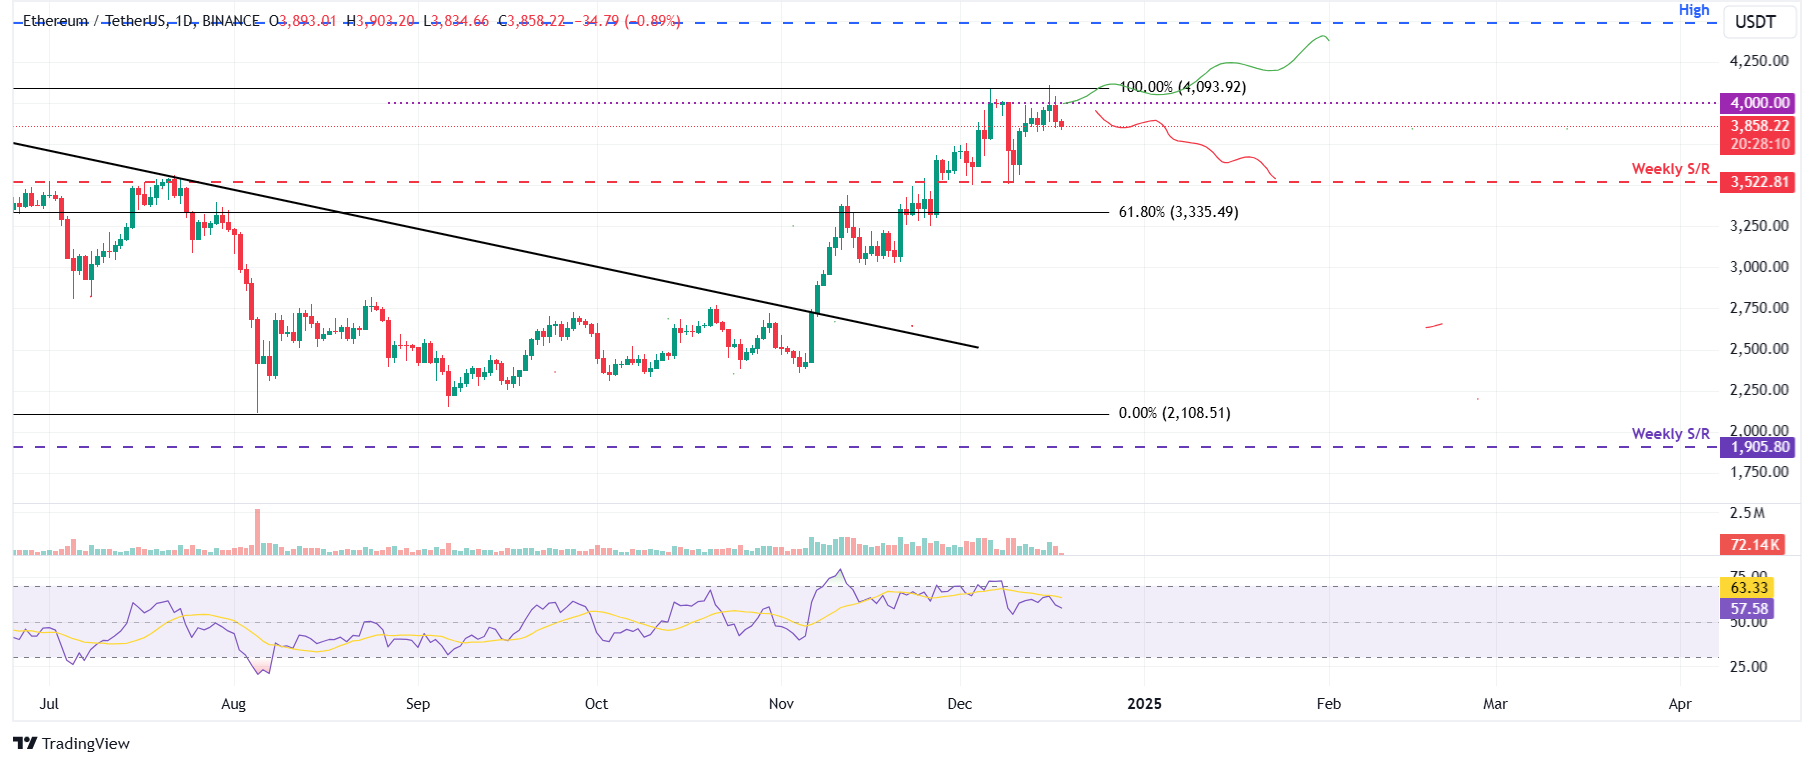
Ethereum faces rejection at $4,000, indicating potential for a correction.
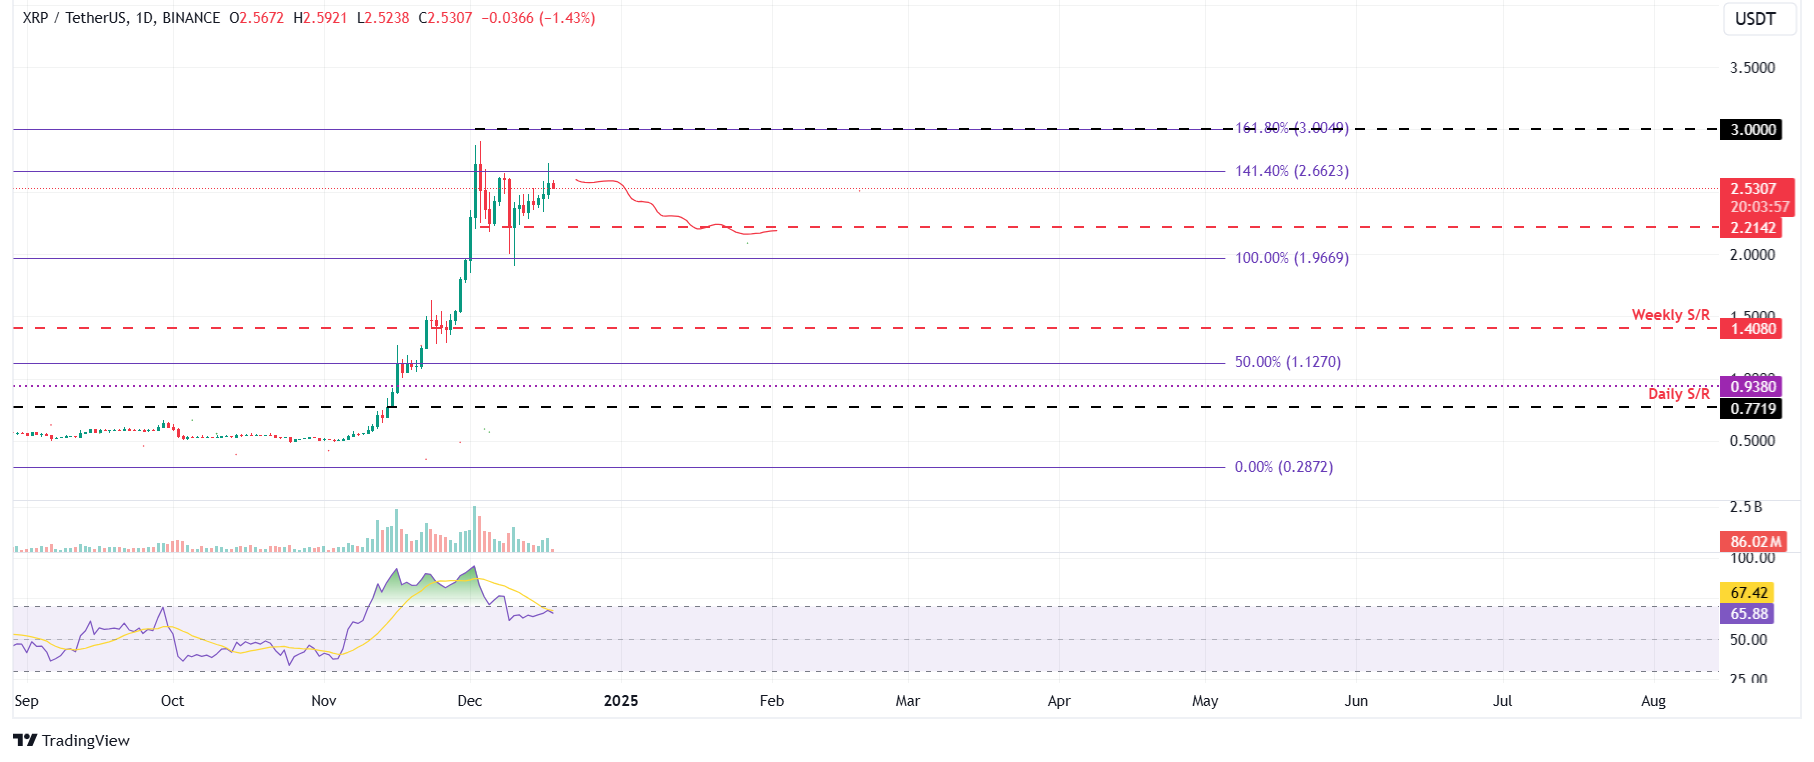
Ripple trades down after retesting $2.66, suggesting indecisiveness among traders.
Technical indicators hint at a possible short-term correction for BTC, ETH, and XRP.
The RSI readings indicate decreasing bullish momentum for these cryptocurrencies.
Bitcoin Price Edges Down After New All-Time High
Bitcoin (BTC) price has slightly declined during the Asian session on Wednesday, following a stunning new all-time high of $108,353 the previous day. The technical indicators suggest a potential short-term correction for Bitcoin and its counterparts.
Bitcoin Bulls Show Signs of Exhaustion
After a 3.32% rally last week, Bitcoin reached its peak at $108,353 but is now trading down around $105,019. If the price closes below the $101,109 support level, it could further decline towards $90,000. The Relative Strength Index (RSI) currently reads 66, indicating a decrease in bullish momentum and potential for a sharper price drop if it falls below 50.

BTC/USDT daily chart
If BTC can break above its ATH of $108,353, it could target a new ATH of $119,510, aligned with the Fibonacci extension from the previous highs.
Ethereum Faces Resistance at $4,000
Ethereum (ETH) has experienced a rejection at the $4,000 level, trading down around $3,858 after a 2.34% decline. Continued resistance at $4,000 may lead ETH to retest its weekly support at $3,522. The RSI reads 57, indicating early signs of bearish momentum.

ETH/USDT daily chart
A break above $4,000 could see ETH rally up to its previous high of $4,488.
Ripple Shows Indecisiveness
Ripple (XRP), having found support around $1.96, rallied 16% but faces slight rejection near the $2.66 level, currently trading around $2.53. If this resistance continues, XRP could decline to retest $2.21. The RSI at 65 suggests indecisiveness among traders.

XRP/USDT daily chart
Should XRP break above $2.66, it could target the significant level of $3.00.
FAQs on Bitcoin and Altcoins
- Bitcoin is the largest cryptocurrency, functioning as a decentralized form of currency.
- Altcoins refer to any cryptocurrency other than Bitcoin, with Ethereum often considered a leading alternative.
- Stablecoins are designed to maintain a stable value, usually pegged to fiat currencies like the USD.
- Bitcoin dominance indicates Bitcoin's market share relative to other cryptocurrencies, often increasing during bull runs.
The information presented here is for informational purposes only and does not constitute investment advice.


Comments