
As of August 19, 2024, Bitcoin is trading at $58,061 with a 24-hour intraday range between $57,918 and $60,191. The crypto asset has seen a trading volume of $20.7 billion and maintains a market capitalization of $1.14 trillion. However, multiple timeframes indicate a sustained downtrend, with key resistance levels firmly in place and technical indicators showing weak buying interest.
Bitcoin's Recent Performance
Bitcoin’s 1-hour chart reveals a sharp decline from $60,271 to $57,844, marked by a significant increase in volume, suggesting potential capitulation. The lack of strong upticks indicates that buyer momentum is still weak. Currently, the price is in a consolidation phase, with minor movements reflecting market indecision.
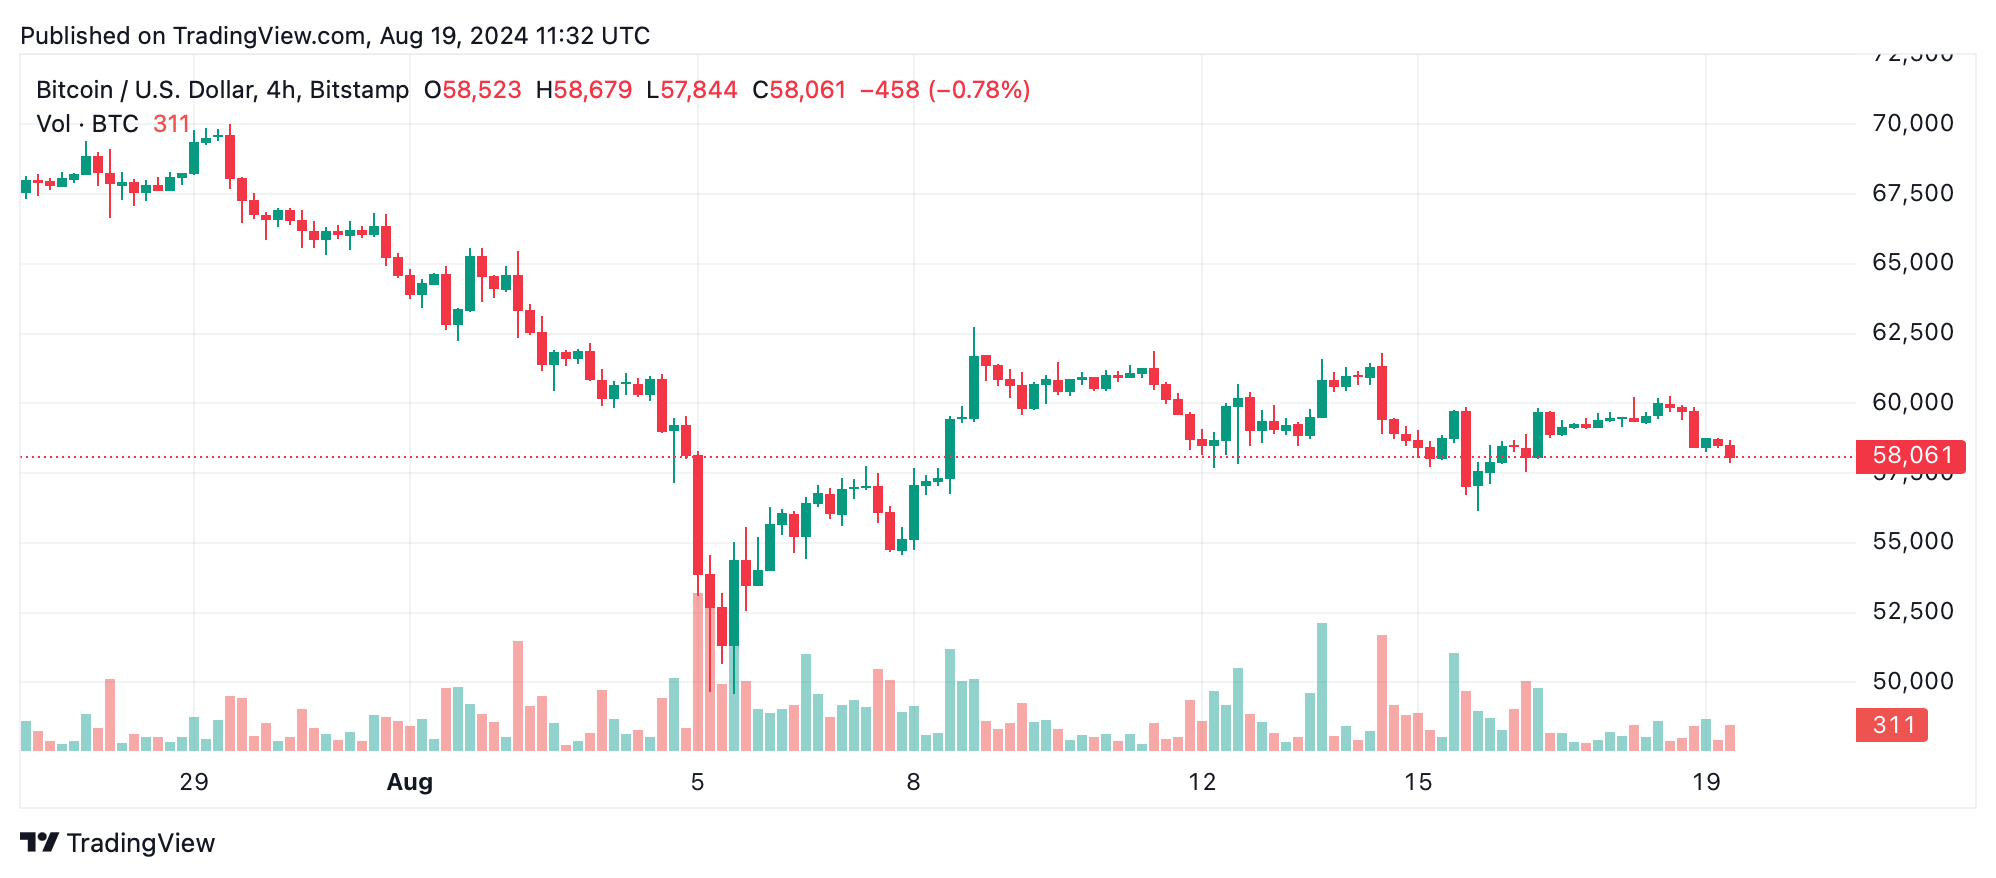
The 4-hour chart reinforces the bearish outlook, revealing substantial resistance at $61,809 before a sharp sell-off to $56,138. Although there was a brief recovery attempt, the overall trend remains bearish, with a volume spike during the sell-off and decreasing volume during recovery indicating a lack of strong buying support.
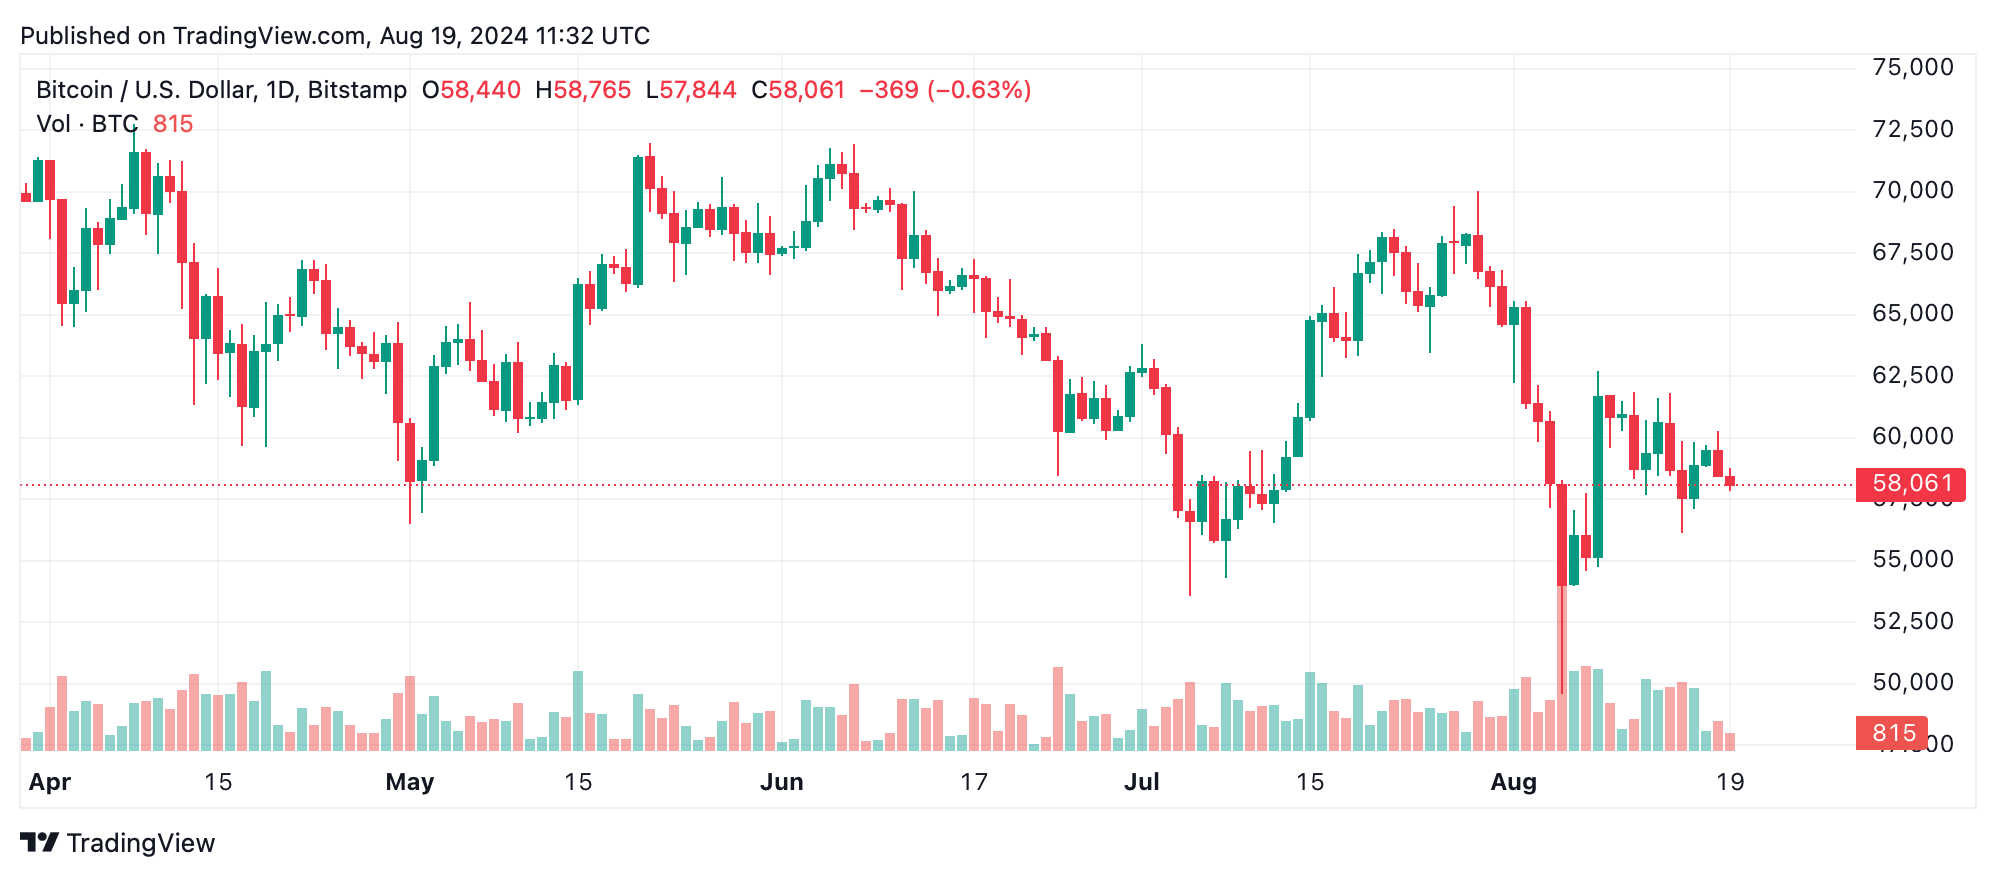
On the daily chart, Bitcoin's sustained downtrend since the peak of $70,016 continues, with the latest drop nearing $57,800. Analysis shows heavy selling pressure, with high volume accompanying major declines while green days see weaker volume, suggesting seller dominance.
Technical Indicators
The readings from oscillators further confirm the bearish outlook, with the Relative Strength Index (RSI) at 43.8, indicating a neutral zone. The Moving Average Convergence Divergence (MACD) level at -1,181.7 provides a sell signal, while other indicators like the Stochastic (63.5) and Commodity Channel Index (CCI) (-45.6) remain neutral. Momentum stands as the only bullish sign, hinting at a potential buy signal, although it lacks support from broader price action.
The moving averages across all timeframes reinforce the bearish trend for Bitcoin. Significant moving averages signal a sell, with the 10-day and 20-day EMAs below current prices at $58,974 and $59,883, respectively. Even the 200-day SMA, a long-term trend indicator, is above the current price, indicating that the bearish trend is deeply entrenched.
Bull Verdict:
Despite the bearish sentiment, there is potential for a short-term bounce if Bitcoin can break above the $58,800-$59,000 resistance with strong volume. Momentum indicators suggest a window for opportunistic buying if a reversal pattern appears on the daily chart. Caution is advised, with tight stop-losses in place.
Bear Verdict:
The overall technical outlook for Bitcoin remains firmly bearish across all timeframes. With persistent downward pressure and weak recovery attempts, the probability of further declines is high. Traders should brace for continued weakness, especially if Bitcoin fails to reclaim critical support levels or if selling volume increases.
What do you think about Bitcoin’s market action on Monday? Share your thoughts in the comments below.


Comments
Join Our Community
Sign up to share your thoughts, engage with others, and become part of our growing community.
No comments yet
Be the first to share your thoughts and start the conversation!