Summary:
Bitcoin trading around $96,500 after a 2.5% recovery this week.
Historically, January yields modest returns of 3.35%.
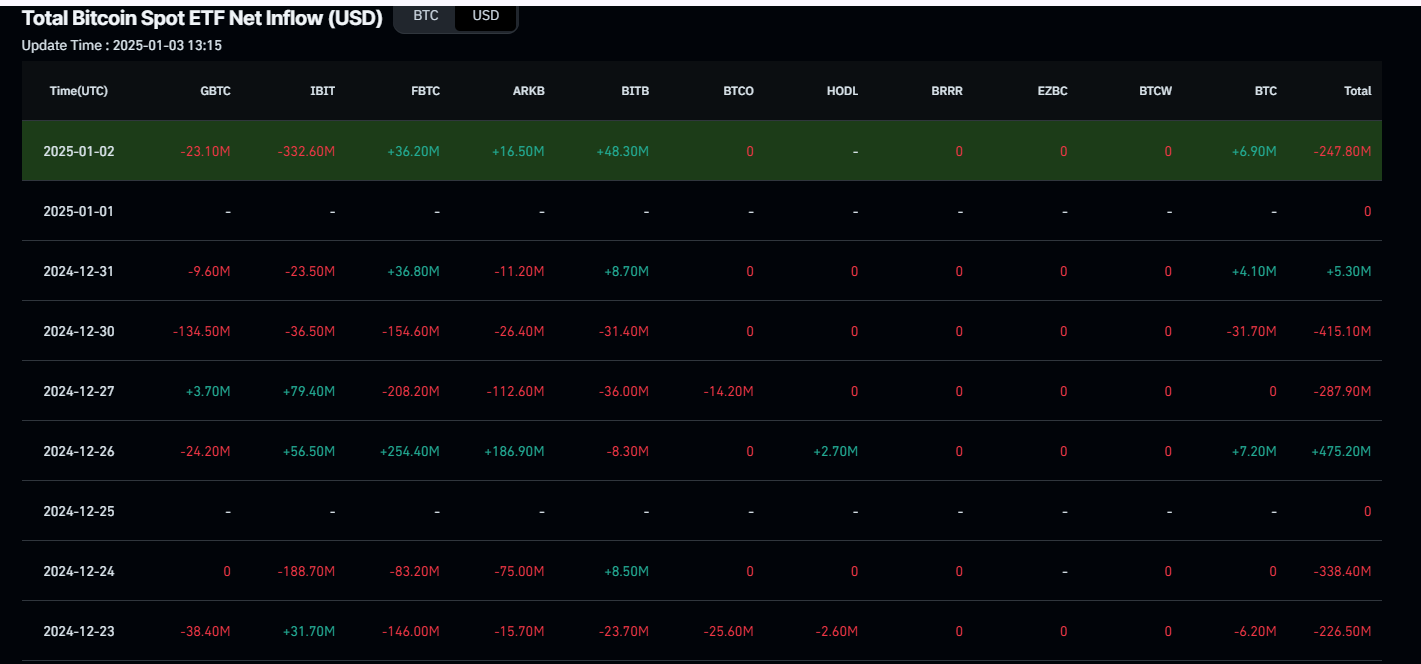
Institutional demand weakened with a total net outflow of $657.6 million.
Current phase indicates a cooling-off period in the ongoing bull market.
Support found at $92,493, with potential to reach $100,000 if it holds.
Bitcoin Price Update
Bitcoin (BTC) is trading around $96,500 on Friday after a 2.5% recovery this week. Historical data indicates that January typically yields modest returns of 3.35% for traders. On-chain metrics suggest the bull market is still intact, indicating a cooling-off phase rather than a peak.
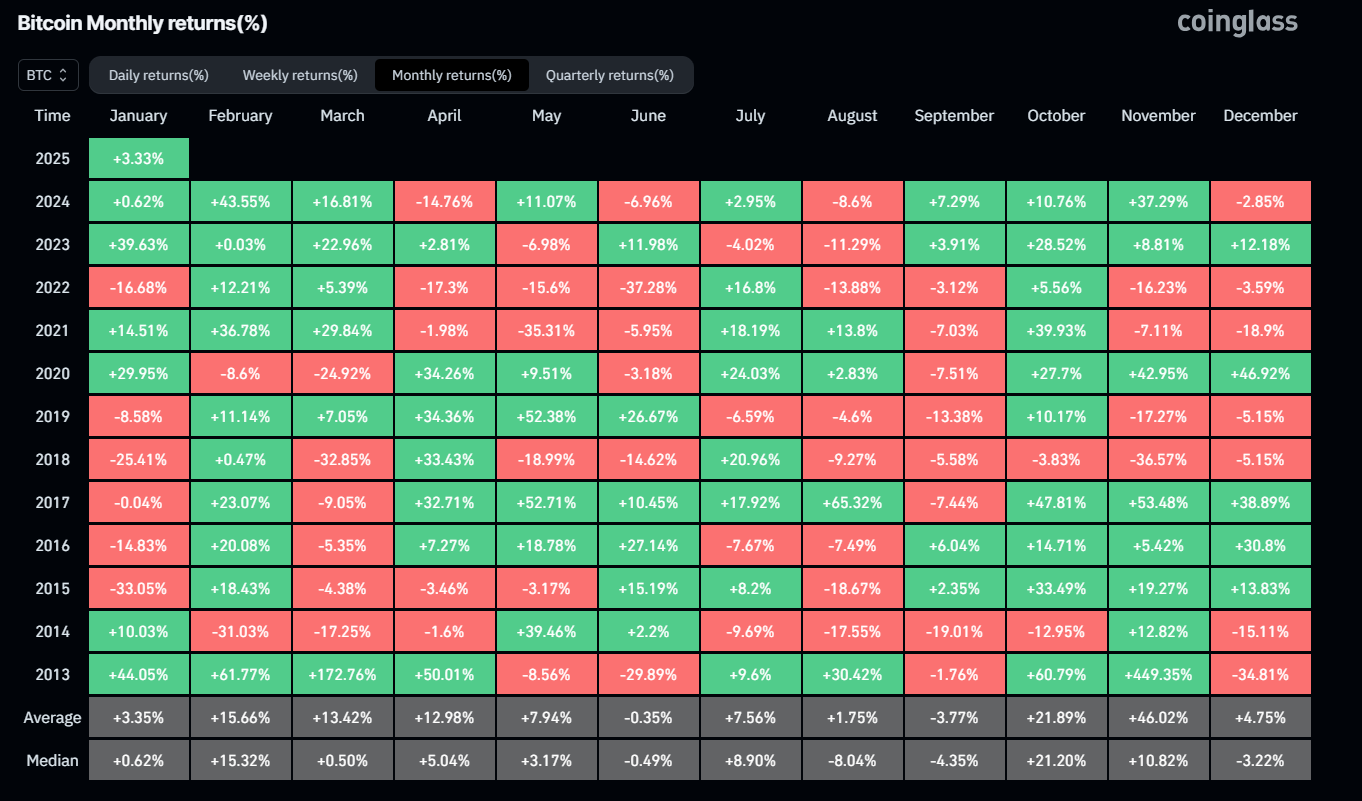
January Returns and Demand Trends
Bitcoin started the year with a modest recovery, trading above $96,000 after a more than 10% drop from a record high of $108,353 on December 17, 2024. Institutional demand has weakened, with Bitcoin Spot ETFs recording a total net outflow of $657.6 million until Thursday, following $377.6 million last week. A continuation of this outflow may lead to further declines in Bitcoin's price.
Bull Market Analysis
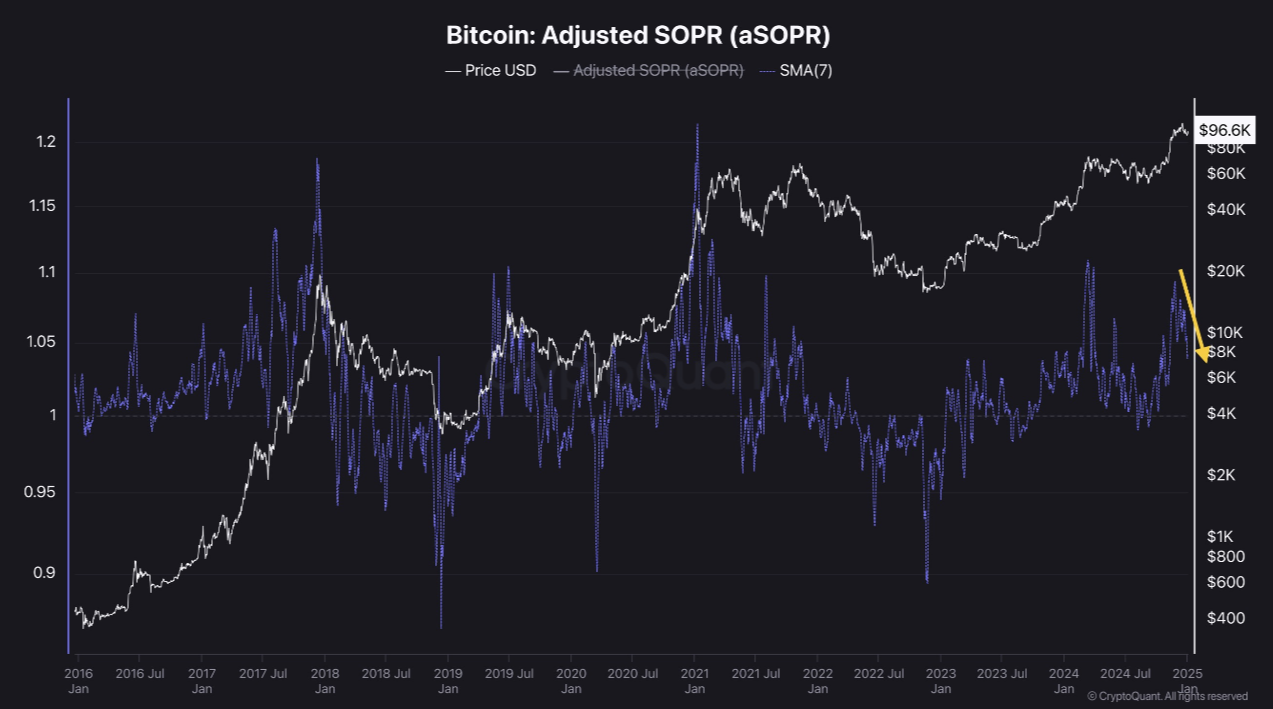
According to CryptoQuant, the current phase suggests that the bull market remains intact. The SOPR (Spent Output Profit Ratio) metric indicates decreasing profits for market participants, with a downward trend suggesting potential rebounds when selling at a loss triggers reversals.
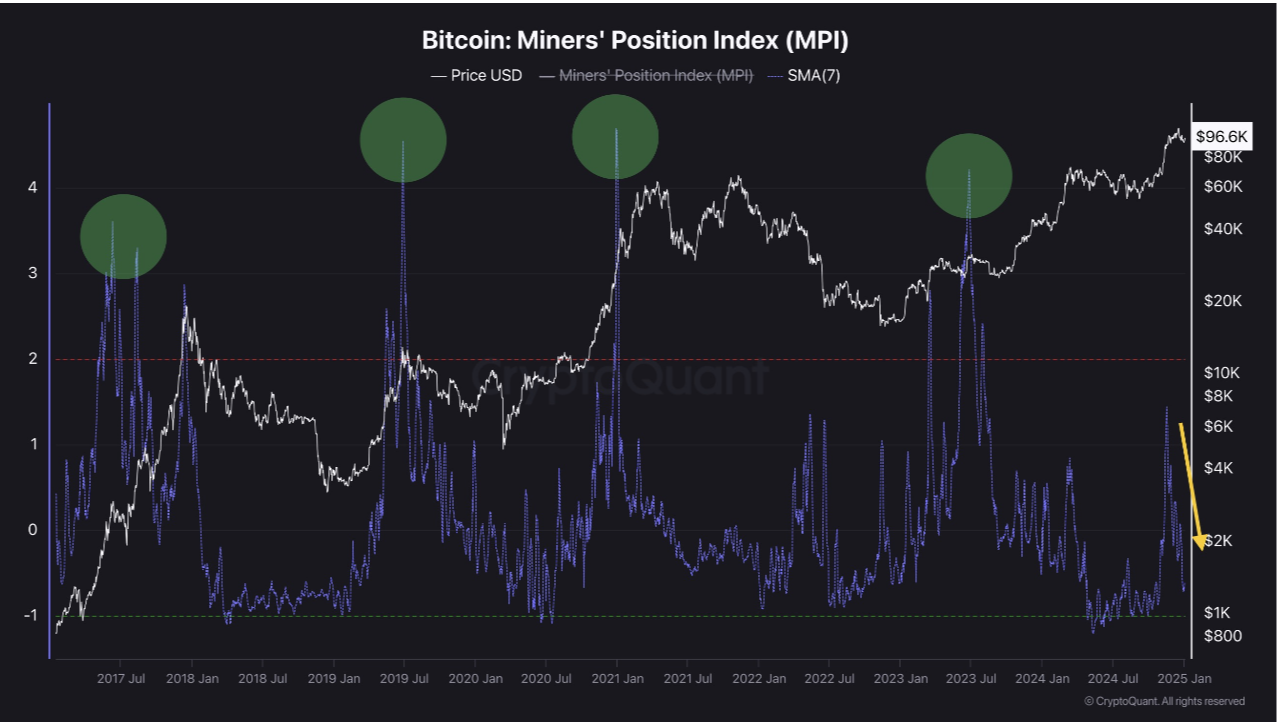
Additionally, the Miner Position Index (MPI) shows no signs of mass transfers to exchanges, indicating that large mining firms are holding Bitcoin as part of their assets. However, traders should remain cautious of periodic sell-offs.
Price Predictions
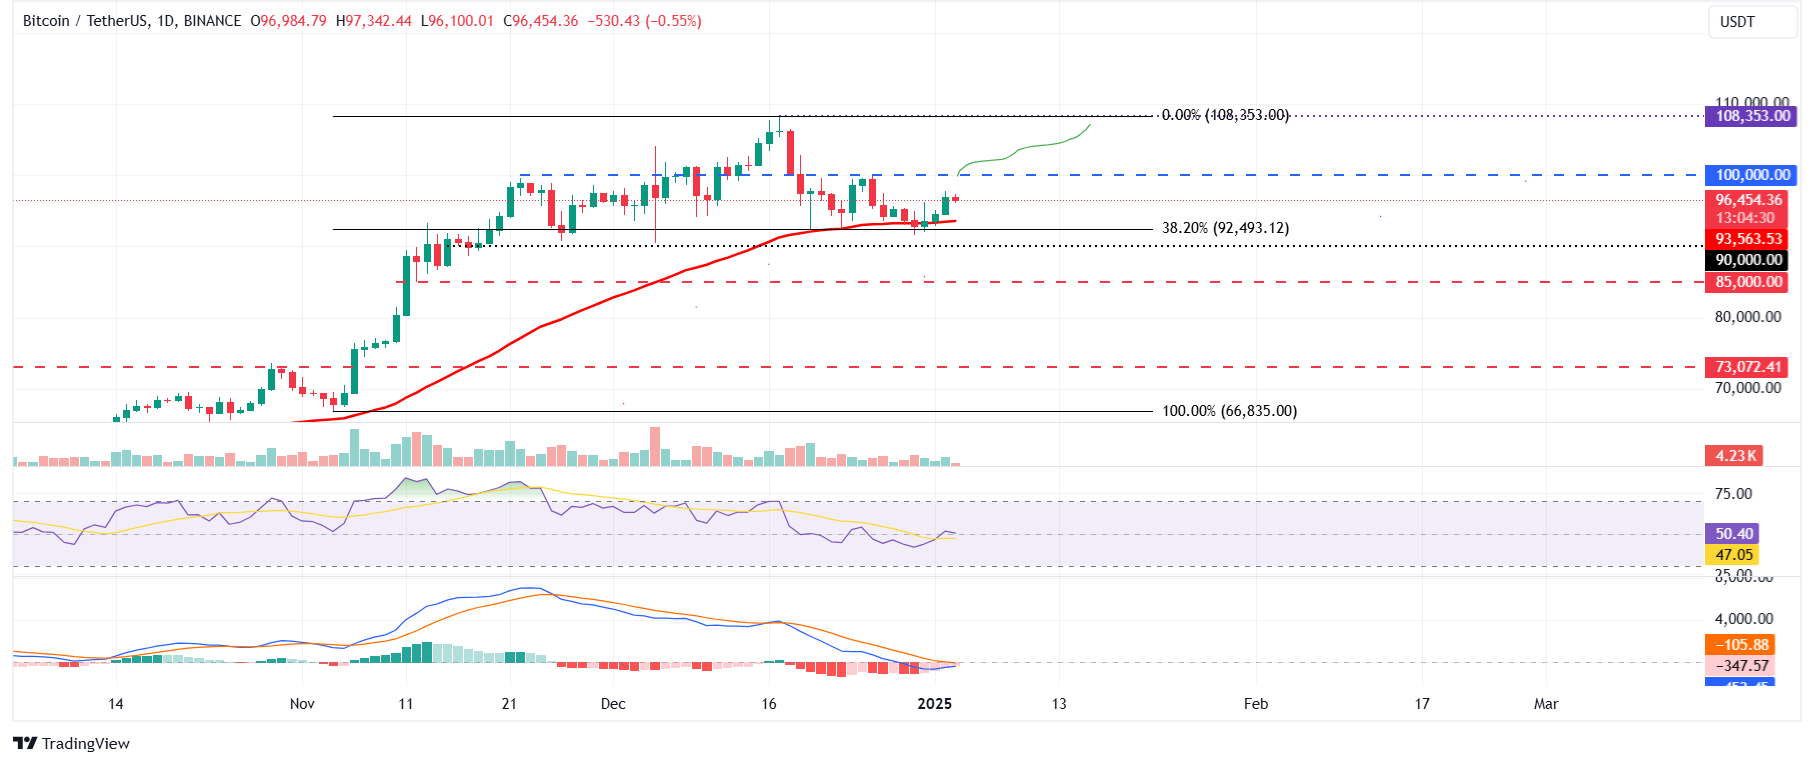
Bitcoin has found support around the 38.2% Fibonacci retracement level at $92,493. If this support holds, BTC could extend its rally towards the $100,000 mark. A successful close above that level may lead to a retest of the all-time high of $108,353.
The RSI on the daily chart indicates weakness in bullish momentum, while the MACD is approaching a bullish crossover, potentially signaling an upward trend. However, a close below $92,493 could lead to a decline towards $90,000.
FAQs on Bitcoin and Market Dynamics
- Bitcoin is the largest cryptocurrency, designed to operate without central control.
- Altcoins refer to all cryptocurrencies aside from Bitcoin, with Ethereum often excluded from this classification.
- Stablecoins are cryptocurrencies pegged to stable assets like the USD to mitigate volatility.
- Bitcoin dominance measures Bitcoin's market capitalization relative to the total cryptocurrency market, indicating investor interest.
Note: The information provided is for informational purposes and should not be considered as investment advice.


Comments