Bitcoin Faces Resistance Near All-Time High
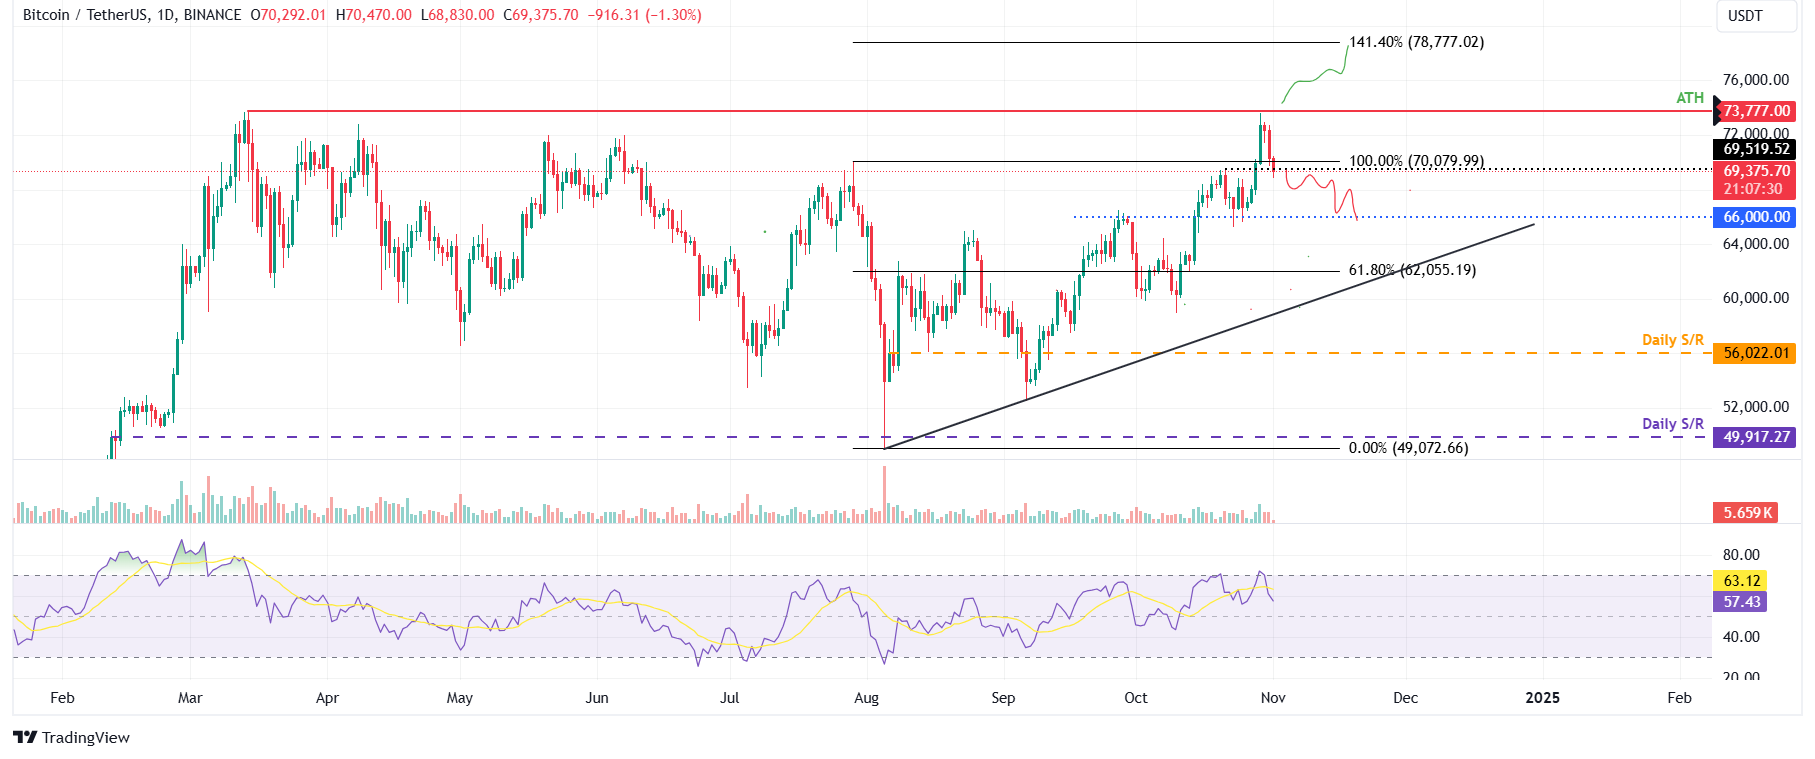
Bitcoin is currently declining and is nearing its key support level of $69,500. A sustained close below this mark could trigger further declines. As of Friday, Bitcoin trades around $69,400, reflecting a 3.2% decline from its all-time high (ATH) of $73,777 seen in mid-March. If it continues to decline and closes below the $69,500 level, it could extend its decline by over 5% to retest the next key support level at $66,000.

The Relative Strength Index (RSI) peaked at an overbought level of 70 but has since dropped to 57, indicating a weakening bullish momentum. However, if Bitcoin holds above $69,500, it may reattempt to break through its ATH.
Ethereum's Downturn Potential
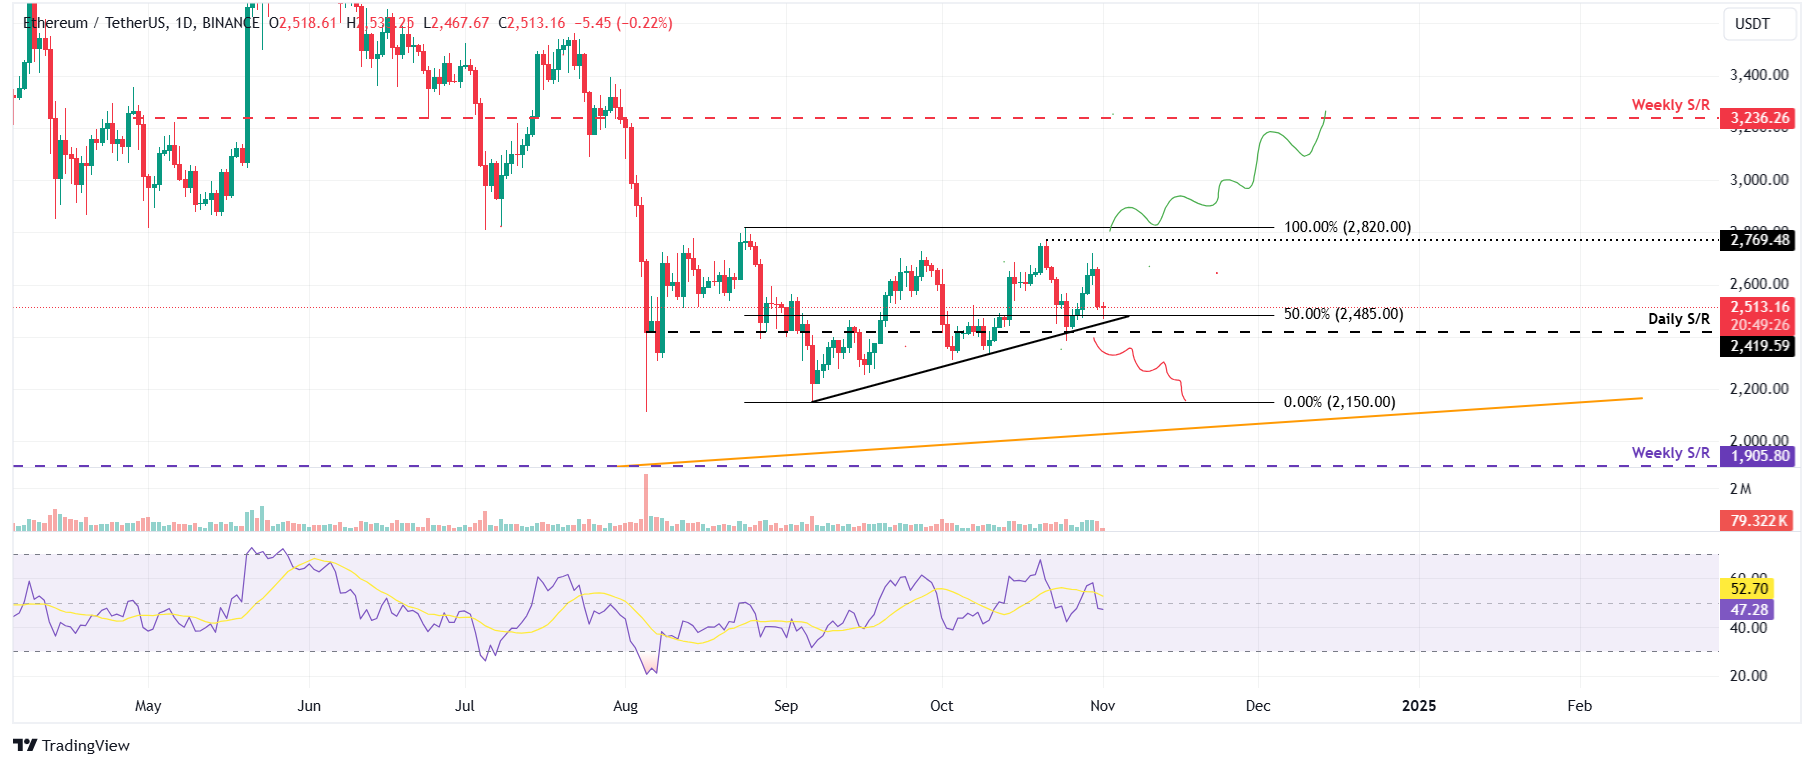
Ethereum is also facing critical levels, with its price nearing $2,450 after a decline of 5.4% on Thursday. This level aligns with the 50% price retracement at $2,485 and the ascending trendline from early September. A close below the $2,419 support level could lead to an 11% decline, retesting the September 6 low of $2,150.

The RSI for Ethereum is at 47, below neutral, suggesting increasing bearish momentum. If the ascending trendline holds, Ethereum could rally to retest its October 21 high of $2,769.
Ripple's Signs of Weakness
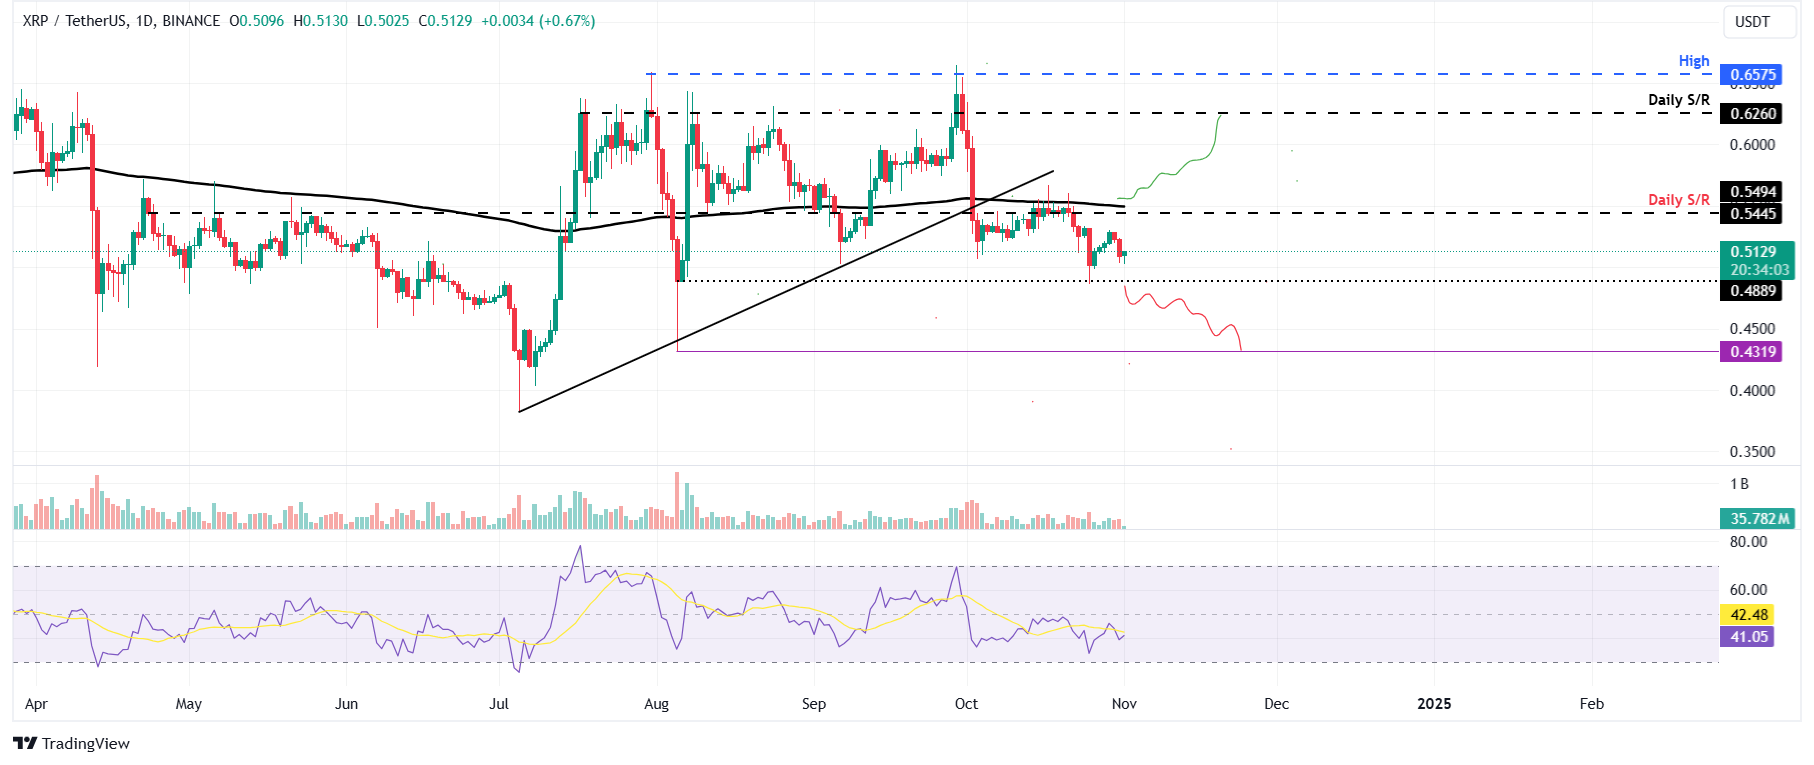
Ripple is facing resistance around $0.544, with a 3.5% decline observed until Thursday. Currently trading around $0.512, if Ripple closes below $0.488, it may extend its decline by 12% to retest the August 5 low of $0.431.

The RSI for Ripple is at 41, signaling bearish momentum. A close above the 200-day EMA at $0.549 could see a potential rally of 13%, retesting the next resistance level at $0.626.


Comments
Join Our Community
Sign up to share your thoughts, engage with others, and become part of our growing community.
No comments yet
Be the first to share your thoughts and start the conversation!